Last summer during a project at the university I was confronted with a problem a lot of young researchers and students come to face: I had just finished a ton of measurements and now needed to plot all of it to get a feel for the data and see if everything went well. I was sitting on >300 txt-files with millions of rows, luckily already named after a certain scheme because I had suspected during the measurements that I’d need some kind of bulk processing/ examination to get through all that.
At the time I had never heard of Origin before (which my university actually offers for €10 per year). But to be honest, even now for my master’s thesis, when somebody introduced me to it, I’m still wary of the C-coding I’d have to do to get the things done I can already do in gnuplot and latex. So this short ‘guide’ is meant for people in a similar situation.
so are you
- sitting on lots and lots of rather simple data (UI-characteristic for example)
- requiring lots and lots of plots from that data
- have multiple files for a sample and want to integrate it into one plot (for a lot of samples at once)
- or you have one file containing multiple lines of data and want to plot them separately but still in one go for lots of files
- don’t want to copy/paste all these graphs into some word-file
- + maybe add a picture to each measurement, sample#, comment, whatever
this might be a way for you to achieve this without proprietary software. Everything free-to-use. This is not to show you how to make nice plots or lots of options, I’m basically just gonna showcase some coding here that makes the above points possible rather easily. I think readjusting that code to somebody else’s needs is much easier than doing the ground-up work of looking up all the necessary segments of code in 3 different languages yourself (gnuplot, latex, python) — some of that might still be necessary of course, less so than before I hope 😉
so without further ado, I’ll start with the gnuplot-bit:
Gnuplot
you can get gnuplot here
a decent edit for it under Windows is gpedit
there’s no preparing you for what the code looks like. I don’t think I can make it look less intimidating here on wordpress, in gpedit it is colored and looks nicer. There’s some german mixed into it (it’s my native language) but only for naming bits – I tend to mix german and english a lot. I’ll explain the gist of it below
reset
set terminal pngcairo size 350,250 noenhanced font 'Verdana,7'
set decimalsign ','
set decimalsign locale
set style line 1 lt 1 ps 0.6 lc rgb "blue" lw 1
set style line 2 lt 1 ps 0.6 lc rgb "orange" lw 1
set style line 3 lt 1 ps 0.6 lc rgb "red" lw 1
set style line 4 lt 1 ps 0.6 lc rgb "black" lw 1

#Hexpad number:
hex = 'Hex06'
material = 'Au'

# field = gemessenes Feld + Verbindungsfelder (spez. Reihenfolge), seg = #Segmente, type = Mess-Typ (4P, Transferkennlinie, etc.)
INPUT(hex,field1,seg1,type1) = ''.hex.'/'.hex.'_2P_'.type1.'_'.seg1.'seg_field'.field1.'.txt'
OUTPUT(hex,field2,seg2,type2,voltage5) = ''.hex.'/2P_'.type2.'_all-currents_'.hex.'_'.seg2.'seg_field'.field2.'_'.voltage5.'V.png'
name(hex,field3,seg3,material1,type1) = hex.", Feld ".field3."\n".seg3." ".material1."-Segment(e)"

style(voltage2) = (voltage2 eq '+15') ? (3) : (voltage2 eq '-15') ? (1) : (voltage2 eq '+2') ? (3) : (voltage2 eq '-2') ? (1) : (4)
linetitle(voltage3) = (voltage3 eq '+15') ? ('+15V') : (voltage3 eq '-15') ? ('-15V') : (voltage3 eq '0') ? ('0V') : (voltage3 eq '+2') ? ('+2V') : (voltage3 eq '-2') ? ('-2V') : ('ERROR')
voltageif(voltage4) = (voltage4 eq '+15') ? ('1,500000E+1') : (voltage4 eq '-15') ? ('-1,500000E+1') : (voltage4 eq '0') ? ('0,000000E+0') : (voltage4 eq '-2') ? ('-2,000000E+0') : (voltage4 eq '+2') ? ('2,000000E+0') : ('ERROR')

print '2-Punkt-Messungen'
print ''
set xlabel 'Voltage (V)'
set ylabel 'current (pA)'#'\Symbol D V'

do for [type in 'UI TR']{
 print type.'-Kennlinie, Messungen:'
 print ''
 do for [field in '03_2h3h 03_23 04_6h5 04_36h 04_55h 06_55h 07_6h5 07_44h 07_55h 07_66h 06_6h5 07_5hh4 07_34 09_13 16_12 08_16']{
 #to be set manually
 if(field eq '03_2h3h'){seg = 0}
 if(field eq '03_23'){seg = 0}
 if(field eq '04_6h5'){seg = 0}
 if(field eq '04_36h'){seg = 0}
 if(field eq '04_55h'){seg =0}
 if(field eq '06_1h1'){seg =0}
 if(field eq '06_24'){seg =0}
 if(field eq '06_55h'){seg =0}
 if(field eq '06_66h'){seg =0}
 if(field eq '07_6h5'){seg =0}
 if(field eq '07_44h'){seg =0}
 if(field eq '07_55h'){seg =0}
 if(field eq '07_66h'){seg =0}
 if(field eq '10_24'){seg =0}
 if(field eq '10_34h'){seg =0}
 if(field eq '10_43'){seg =0}
 if(field eq '13_1h1'){seg =0}
 #1-seg
 if(field eq '02_23'){seg =1}
 if(field eq '03_32h'){seg =1}
 if(field eq '05_24'){seg =1}
 if(field eq '06_6h5'){seg =1}
 if(field eq '06_12'){seg =1}
 if(field eq '06_43'){seg =1}
 if(field eq '07_5hh4'){seg =1}
 if(field eq '07_34'){seg =1}
 if(field eq '09_13'){seg =1}
 if(field eq '13_12'){seg =1}
 if(field eq '13_56'){seg =1}
 if(field eq '16_2h3hh'){seg =1}
 if(field eq '16_12'){seg =1}
 if(field eq '17_15'){seg =1}
 if(field eq '17_16h'){seg =1}
 #multi-seg
 if(field eq '08_16'){seg =2}
 if(field eq '14_nc2h'){seg =3}
 #

 if(type eq 'UI'){
 do for [voltage in '+15 0 -15']{
 #set xrange [-0.1:0.1]
 set output OUTPUT(hex,field,seg,type,voltage)
 set title "UI-Kennlinie\n".name(hex,field,seg,material,type)."\nVG @".voltage."V"
 print 'reading file: '.INPUT(hex,field,seg,type)
 set xlabel 'V-Drain (V)'
 plot INPUT(hex,field,seg,type) u 1:((stringcolumn(5) eq voltageif(voltage)) ? ($2*10**12) : 1/0) ls 1 title 'ID' w lp, '' u 1:((stringcolumn(5) eq voltageif(voltage)) ? (-$4*10**12) : 1/0) ls 3 title 'IS' w lp, '' u 1:((stringcolumn(5) eq voltageif(voltage)) ? ($6*10**12) : 1/0) ls 4 title 'IG' w lp
 print 'created file: '.OUTPUT(hex,field,seg,type,voltage)
 }
 }
 if(type eq 'TR'){
 do for [voltage in '+2 0 -2']{
 set xrange [-15:15]
 set output OUTPUT(hex,field,seg,type,voltage)
 set title "Transfer-Kennlinie\n".name(hex,field,seg,material,type)."\nVD @".voltage."V"
 print 'reading file: '.INPUT(hex,field,seg,type)
 set xlabel 'V-Gate (V)'
 plot INPUT(hex,field,seg,type) u 5:((stringcolumn(1) eq voltageif(voltage)) ? ($2*10**12) : 1/0) ls 1 title 'ID' w lp, '' u 5:((stringcolumn(1) eq voltageif(voltage)) ? (-$4*10**12) : 1/0) ls 3 title 'IS' w lp, '' u 5:((stringcolumn(1) eq voltageif(voltage)) ? ($6*10**12) : 1/0) ls 4 title 'IG' w lp
 print 'created file: '.OUTPUT(hex,field,seg,type,voltage)
 }
 }
 print ''
 }
 print ''

}
set output ''.hex.'/empty-file.txt'

exit
a typical filename for a sample was for example: Hex06_2P_UI_0seg_field07_6h5.txt
- Hex06 specified the 6th sample with structures for measurement prepared on it (up to 40)
- 2P_UI is the type of measurement (in this case 2 point voltage-current characteristic)
- 1seg specified a certain property of the measured specimen (# of segments) that I wanted to have in the filename
- field07_6h5 specified the exact structure I measured on the sample (field 7 between contacts 6h and 5)
so by necessety my files were named rather complicatedly (for example field10_34 might have 4seg but field01_22h had 1seg) so I needed a way to make a loop structure in gnuplot but with varying files and labels. I found that way using assembly String-functions for filenames and case-sensitive String-functions (below). An example for an assembly String-function is the INPUT()-function:
INPUT(hex,field1,seg1,type1) = ''.hex.'/'.hex.'_2P_'.type1.'_'.seg1.'seg_field'.field1.'.txt'
This function takes all the above arguments as string variables, so I can plug in anything I want. The files are in a subdirectory (named Hex06 too). Before plotting all filenames (input and ouput) are printed. It’s usually a good idea to leave out the set output and plot parts (comment-char #) before trying anything new – the error message usually just shows when there’s a problem inside the loop and not what part of it.
Then I use a loop over the plot-function and generate the output to
OUTPUT(hex,field2,seg2,type2,voltage5) = ''.hex.'/2P_'.type2.'_all-currents_'.hex.'_'.seg2.'seg_field'.field2.'_'.voltage5.'V.png'
which specifies a file using different variables needed.
In the code above I had the following situation:
- I had done 2 different types of measurements
- + 3x each measurement on each sample structure
- + wanted a pic of the sample structure nex to the data to assess if some features are explainable by the looks of it (pics I had prepared and named after the structure (field05_34h or whatever)
so in case of the UI-measurement I needed to loop over +15V|0V|-15V, in case of the TR-measurement I needed -2V|0V|2V to make 3x UI-plot and 3x TR-plot of one structure in one go.
Through several IF-statements and case-sensitive String-functions (a little further below 😉 ) I split up the cases and
- assigned the seg-number to each structure
- assigned plot titles, labels and so on
Through some complicated if-then commands (the ? and : stuff) I set up line titles. This can be done more easily by defining a string depending on TR or UI measurement though. In this case I had it set up already for another reason so I used it rather than changing it.
One of the stranger bits of code is in the plot function defining the columns to plot
plot INPUT(hex,field,seg,type) 5:((stringcolumn(1) eq voltageif(voltage)) ? ($2*10**12) : 1/0) #.........
This is a workaround in gnuplot to force it to only plot certain parts of a file. The gist of it is forcing it into an error (1/0) if some condition (stringcolumn(1) eq voltageif(voltage)) is not met. In my case column 1 of my measurement file held the gate voltage. I wanted a plot at each voltage, not all of them at once. voltageif() is defined near the top and one of the previously mentioned case-sensitive String-functions:
voltageif(voltage4) = (voltage4 eq '+15') ? ('1,500000E+1') : (voltage4 eq '-15') ? ('-1,500000E+1') : (voltage4 eq '0') ? ('0,000000E+0') : (voltage4 eq '-2') ? ('-2,000000E+0') : (voltage4 eq '+2') ? ('2,000000E+0') : ('ERROR')
it also applies the priciple of IF-THEN-ELSE, the brackets are just for better visibility. If the voltage I wanted to plot is plugged in, it gives me the number/string that the file actually contains. Then, it is used in the above plot-function to check whether column 1 actually contains the trigger (the +15V string for example). YES -> plot column 2, NO -> force error.
I know, it’s not pretty or intuitive but it works nicely and without problems (at least in this configuration, be wary of this piece of code)
style() and linetitle() work the same way, defining certain plot characteristics depending on what is being plotted. Everything is assembled in the plot-function itself.
In case you need to plot from multiple files at once (assemble data) you can use the plot for [] -command, for example:
plot for [voltage in '+15 0 -15'] INPUT(field,seg,type,voltage,direction) every ::1 u (vorzeichen*($5-$1)):(vorzeichen*(-$4)*10**12) w lp ls style(voltage) title linetitle(voltage)
the print statements are something I like to do, they don’t make anything work but they’re nice to have – especially when debugging.
By the way, Gnuplot does not support exporting to not already existing folders. I actually tried it using the system-command, but out of some reason that didn’t work out (and nobody replied ![]() )
)
I’ll leave the Gnuplot-bit at that, I think it’s quite a lot of explanation for some if-then statements and string functions. The next problem I faced now were around 300 plot files and more on the way.
LaTeX & Python
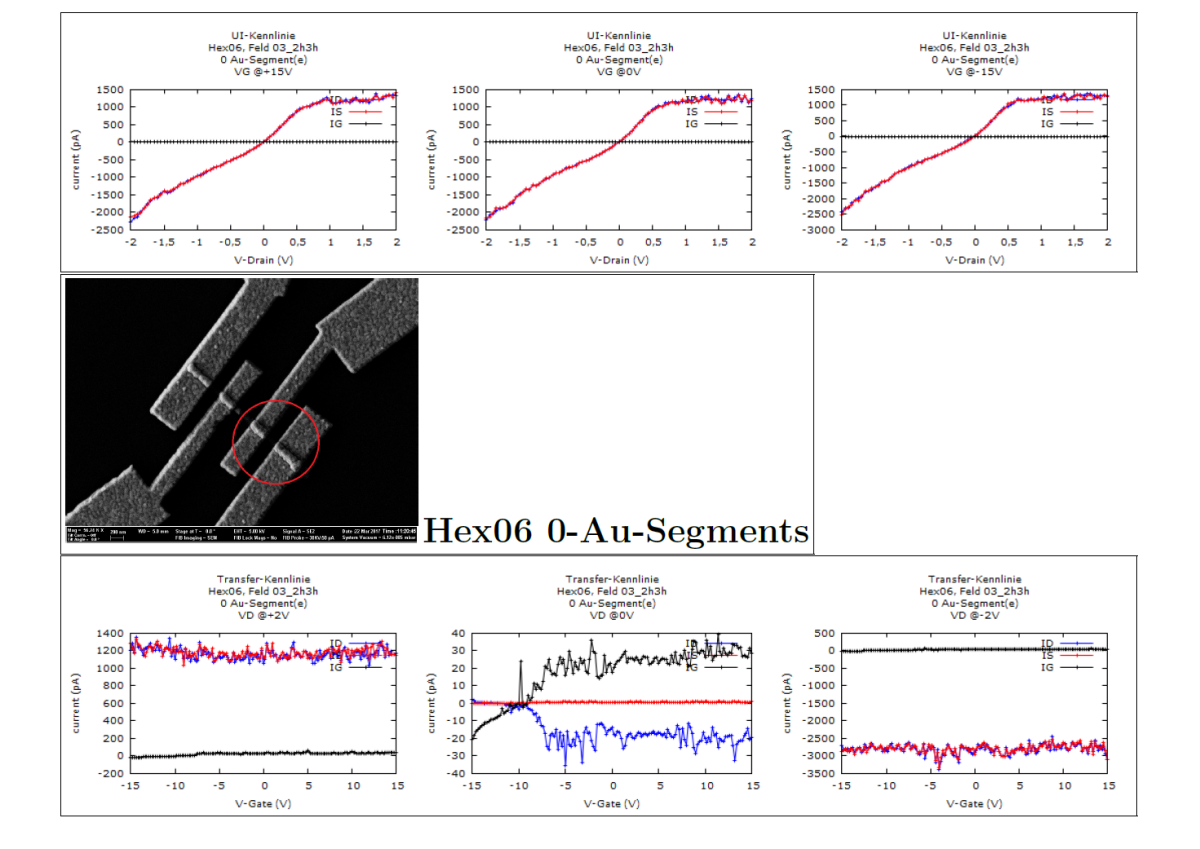
I wanted to use LaTeX to assemble all my files into neat looking sheets, one sheet for each structure containing 6 plots + the SEM-image of the structure. Since I’m no LaTeX-pro I actually had to ask for help on the issue of ordering images here (an issue I resolved by myself a day later). So I prepared some LaTeX-code for one example and wrote a small python-script to generate the exact same code for the other pieces. The end result looked like this: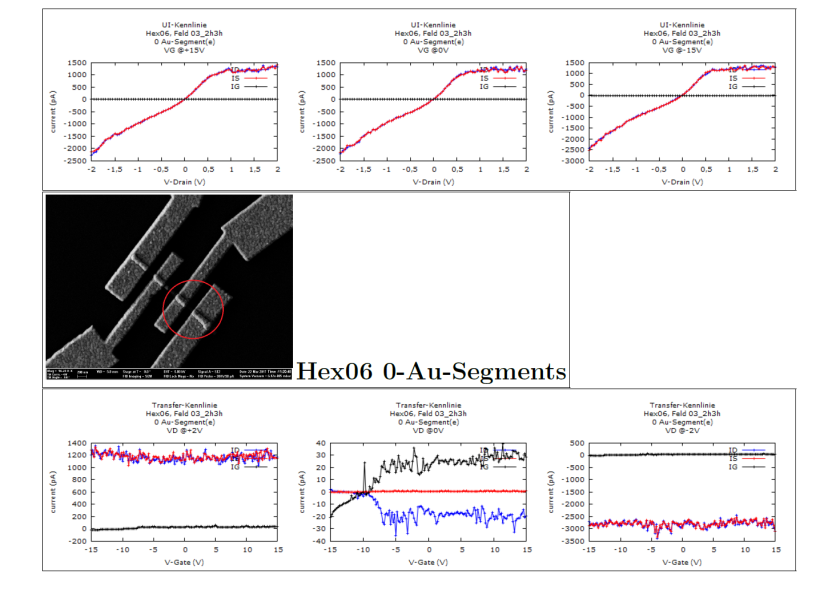
the python-code actually generates three .tex-files that just have to be inserted into a main-tex file with the appropriate packages.
Python
I hope WordPress keeps the indentation correct, if you’re unfamiliar with Python: indendation matters or the code won’t work! (EDIT: damn, indents are gone, after each for loop up until the f.close()-statement the whole row needs to be indented x1)
You can get Python here, an editor for it I like is Atom (Windows, Linux, Mac). It’s my favourite programming language by far. I’m not a huge programmer, just the bits and pieces I need every now and then – Python is just awesome!
The following script just generates 3 .tex-files directly, with some IFs and (rather useless) print-statements in between. I think it’s quite easy to understand.
Python-script:
f = open('Hex06.tex', 'w')

hex = 'Hex06'
print('\n')
print('writing Hex06.tex .....\n')
for field in ['03_2h3h','03_23','04_6h5','04_36h','04_55h','06_55h','07_6h5','07_44h','07_55h','07_66h','06_6h5','07_5hh4','07_34','09_13','16_12','08_16']:
if(field == '03_2h3h'):seg = '0'
if(field == '03_23'):seg = '0'
if(field == '04_6h5'):seg = '0'
if(field == '04_36h'):seg = '0'
if(field == '04_55h'):seg = '0'
if(field == '06_55h'):seg = '0'
if(field == '07_6h5'):seg = '0'
if(field == '07_44h'):seg = '0'
if(field == '07_55h'):seg = '0'
if(field == '07_66h'):seg = '0'
if(field == '06_6h5'):seg = '1'
if(field == '07_5hh4'):seg = '1'
if(field == '07_34'):seg = '1'
if(field == '09_13'):seg = '1'
if(field == '16_12'):seg = '1'
if(field == '08_16'):seg = '2'
f.write('\n')
f.write('\\begin{figure}[!htbp]\n')
f.write('\centering\n')
f.write('\\fbox{\includegraphics[scale = 0.7]{' + hex + '/2P_UI_all-currents_' + hex + '_'+seg+'seg_field'+field+'_+15V.png}\n')
f.write('      \includegraphics[scale = 0.7]{' + hex + '/2P_UI_all-currents_' + hex + '_'+seg+'seg_field'+field+'_0V.png}\n')
f.write('      \includegraphics[scale = 0.7]{' + hex + '/2P_UI_all-currents_' + hex + '_'+seg+'seg_field'+field+'_-15V.png}\n')
f.write('}\n')
f.write('\n')
f.write('\\fbox{\includegraphics[scale = 1]{' + hex + '/SEM-pics/resized/' + hex + '-done_field'+field+'.png}\n')
f.write('\\textbf{{\Huge '+hex+' '+seg+'-Au-Segments}}}')
f.write('\n')
f.write('\\fbox{\includegraphics[scale = 0.7]{' + hex + '/2P_TR_all-currents_' + hex + '_'+seg+'seg_field'+field+'_+2V.png}\n')
f.write('      \includegraphics[scale = 0.7]{' + hex + '/2P_TR_all-currents_' + hex + '_'+seg+'seg_field'+field+'_0V.png}\n')
f.write('      \includegraphics[scale = 0.7]{' + hex + '/2P_TR_all-currents_' + hex + '_'+seg+'seg_field'+field+'_-2V.png}\n')
f.write('      }\n')
f.write('\end{figure}\n')
f.write('\\newpage\n')
f.write('\n')
f.close()
print('done with Hex06.tex, starting Hex07.tex.....\n')
f = open('Hex07.tex', 'w')
hex = 'Hex07'

for field in ['06_41','06_56','08_4h5h','08_45','11_16','14_21','14_66h','18_6h1h','06_15','09_23','18_16h','14_16']:
if(field == '06_41'):seg = '0'
if(field == '06_56'):seg = '0'
if(field == '08_4h5h'):seg = '0'
if(field == '08_45'):seg = '0'
if(field == '11_16'):seg = '0'
if(field == '14_21'):seg = '0'
if(field == '14_66h'):seg = '0'
if(field == '18_6h1h'):seg = '0'
if(field == '06_15'):seg = '1'
if(field == '09_23'):seg = '1'
if(field == '18_16h'):seg = '1'
if(field == '14_16'):seg = '2'
f.write('\n')
f.write('\\begin{figure}[!htbp]\n')
f.write('\centering\n')
f.write('\\fbox{\includegraphics[scale = 0.7]{' + hex + '/2P_UI_all-currents_' + hex + '_'+seg+'seg_field'+field+'_+15V.png}\n')
f.write('      \includegraphics[scale = 0.7]{' + hex + '/2P_UI_all-currents_' + hex + '_'+seg+'seg_field'+field+'_0V.png}\n')
f.write('      \includegraphics[scale = 0.7]{' + hex + '/2P_UI_all-currents_' + hex + '_'+seg+'seg_field'+field+'_-15V.png}\n')
f.write('}\n')
f.write('\n')
f.write('\\fbox{\includegraphics[scale = 1]{' + hex + '/SEM-pics/resized/' + hex + '_field'+field+'.png}\n')
f.write('\\textbf{{\Huge '+hex+' '+seg+'-Ni-Segments}}}')
f.write('\n')
f.write('\\fbox{\includegraphics[scale = 0.7]{' + hex + '/2P_TR_all-currents_' + hex + '_'+seg+'seg_field'+field+'_+2V.png}\n')
f.write('      \includegraphics[scale = 0.7]{' + hex + '/2P_TR_all-currents_' + hex + '_'+seg+'seg_field'+field+'_0V.png}\n')
f.write('      \includegraphics[scale = 0.7]{' + hex + '/2P_TR_all-currents_' + hex + '_'+seg+'seg_field'+field+'_-2V.png}\n')
f.write('      }\n')
f.write('\end{figure}\n')
f.write('\\newpage\n')
f.write('\n')
f.close()
print('done with Hex07.tex, starting Hex10.tex.....\n')
f = open('Hex10.tex', 'w')
hex = 'Hex10'

for field in ['01_1h2','01_6h6','01_13','01_55h','02_55h','02_66h','01_5h6h','01_21','02_6h5','02_34','04_45','05_1h3','07_61','08_4h3','08_32','09_64','12_1h6','16_63']:
if(field == '01_1h2'):seg = '0'
if(field == '01_6h6'):seg = '0'
if(field == '01_13'):seg = '0'
if(field == '01_55h'):seg = '0'
if(field == '02_55h'):seg = '0'
if(field == '02_66h'):seg = '0'
if(field == '01_5h6h'):seg = '1'
if(field == '01_21'):seg = '1'
if(field == '02_6h5'):seg = '1'
if(field == '02_34'):seg = '1'
if(field == '04_45'):seg = '1'
if(field == '05_1h3'):seg = '1'
if(field == '07_61'):seg = '1'
if(field == '08_4h3'):seg = '1'
if(field == '08_32'):seg = '1'
if(field == '09_64'):seg = '1'
if(field == '12_1h6'):seg = '1'
if(field == '16_63'):seg = '1'
f.write('\n')
f.write('\\begin{figure}[!htbp]\n')
f.write('\centering\n')
f.write('\\fbox{\includegraphics[scale = 0.7]{' + hex + '/2P_UI_all-currents_' + hex + '_'+seg+'seg_field'+field+'_+15V.png}\n')
f.write('      \includegraphics[scale = 0.7]{' + hex + '/2P_UI_all-currents_' + hex + '_'+seg+'seg_field'+field+'_0V.png}\n')
f.write('      \includegraphics[scale = 0.7]{' + hex + '/2P_UI_all-currents_' + hex + '_'+seg+'seg_field'+field+'_-15V.png}\n')
f.write('}\n')
f.write('\n')
f.write('\\fbox{\includegraphics[scale = 1]{' + hex + '/SEM-pics/resized/' + hex + '_Au-seg_field'+field+'.png}\n')
f.write('\\textbf{{\Huge '+hex+' '+seg+'-Au-Segments}}}')
f.write('\n')
f.write('\\fbox{\includegraphics[scale = 0.7]{' + hex + '/2P_TR_all-currents_' + hex + '_'+seg+'seg_field'+field+'_+2V.png}\n')
f.write('      \includegraphics[scale = 0.7]{' + hex + '/2P_TR_all-currents_' + hex + '_'+seg+'seg_field'+field+'_0V.png}\n')
f.write('      \includegraphics[scale = 0.7]{' + hex + '/2P_TR_all-currents_' + hex + '_'+seg+'seg_field'+field+'_-2V.png}\n')
f.write('      }\n')
f.write('\end{figure}\n')
f.write('\\newpage\n')
f.write('\n')
f.close()
print('done with Hex10.tex\n')
print('\n')
print('pleasure to do business with you\n')
print('see you next time\n')
print('\n')
LaTeX
LaTeX code (just packages + the generated .tex files from the python-script):
\documentclass[landscape]{article}
\usepackage{graphicx}
\usepackage[a4paper]{geometry}
%\input{setup/header.tex}
\usepackage{a4wide}

\setlength{\oddsidemargin}{-1cm}

\setlength{\topmargin}{-3.5cm}

\begin{document}
\pagenumbering{gobble}

\input{Hex06.tex}
\input{Hex07.tex}
\input{Hex10.tex}

\end{document}
As with the Python-code, I think this bit is fairly self-explanatory, especially if you read the Gnuplot-part. The images are loaded directly from the subdirectory. I prepared the SEM-images with a similar naming scheme in another subdirectory so I could use it in this code. The first time around, all this took about 2 work-days to implement. After that, maybe 20min for any new sample 🙂
Adding unique comments to each page is just a matter of adding a line to the TeX-code that is restricted to a certain sample (new string just for field04_3h2 or so, maybe set to “” afterwards)
some closing statements
Hopefully somebody profits from this short showcase-guide. I’m now in the process of starting to learn Origin for a few ‘nicer’ plots. In case somebody is interested, the research I did here is/was for my diploma thesis on silicon nanowire heterostructures. When my paper and thesis is done I’ll probably link to it here 🙂
This whole post is also meant as a huge THANK YOU to everybody that ever helped me on subjects like these. It can be a huge pain in the ass if you can’t find solutions and it’s great that communities at sourceforge and stackexchange are as active and helpful as they are.
have a nice day,
MB
p.s. If anybody has ideas/ recommendation for better layouting on this site – tell me and I’ll try to improve it. I used WordPress for the first time today so bear with me 😉
